Microsoft SQL Server Performance Analysis
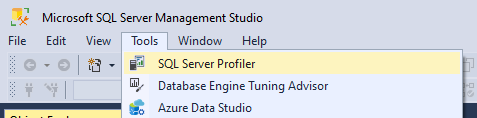
Launch SQL Server Profiler
Filter Long-Running Queries
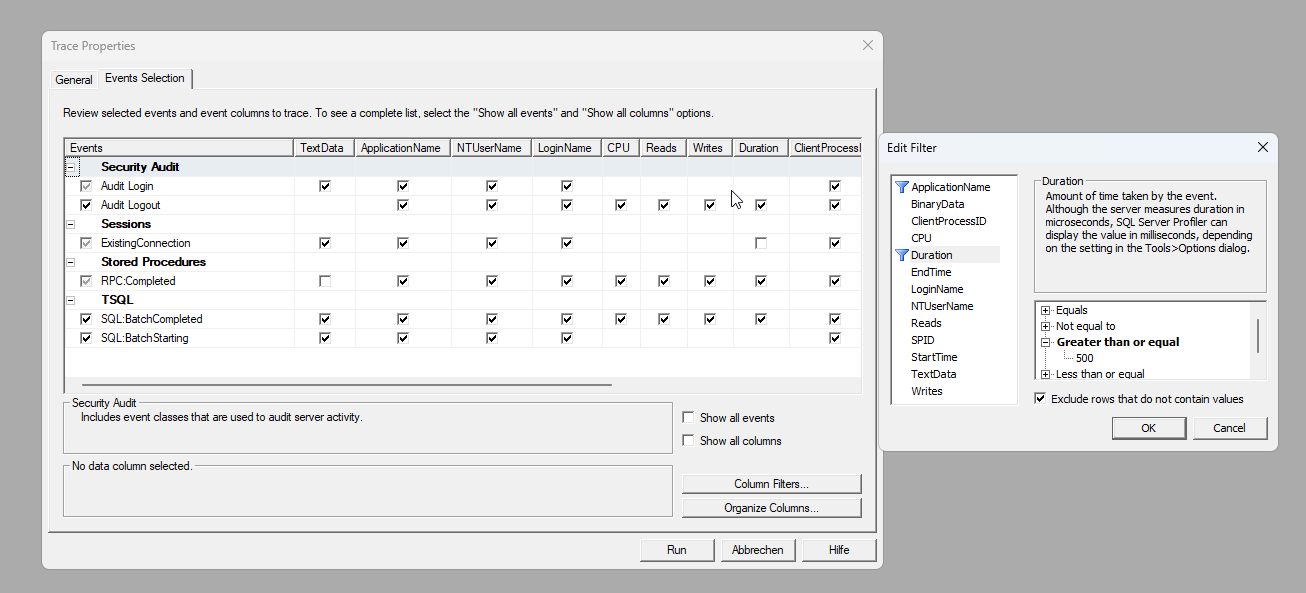
Add a column filter, for example for the "Duration" column, to display all queries that take longer than 500 milliseconds.
Select a query from the log
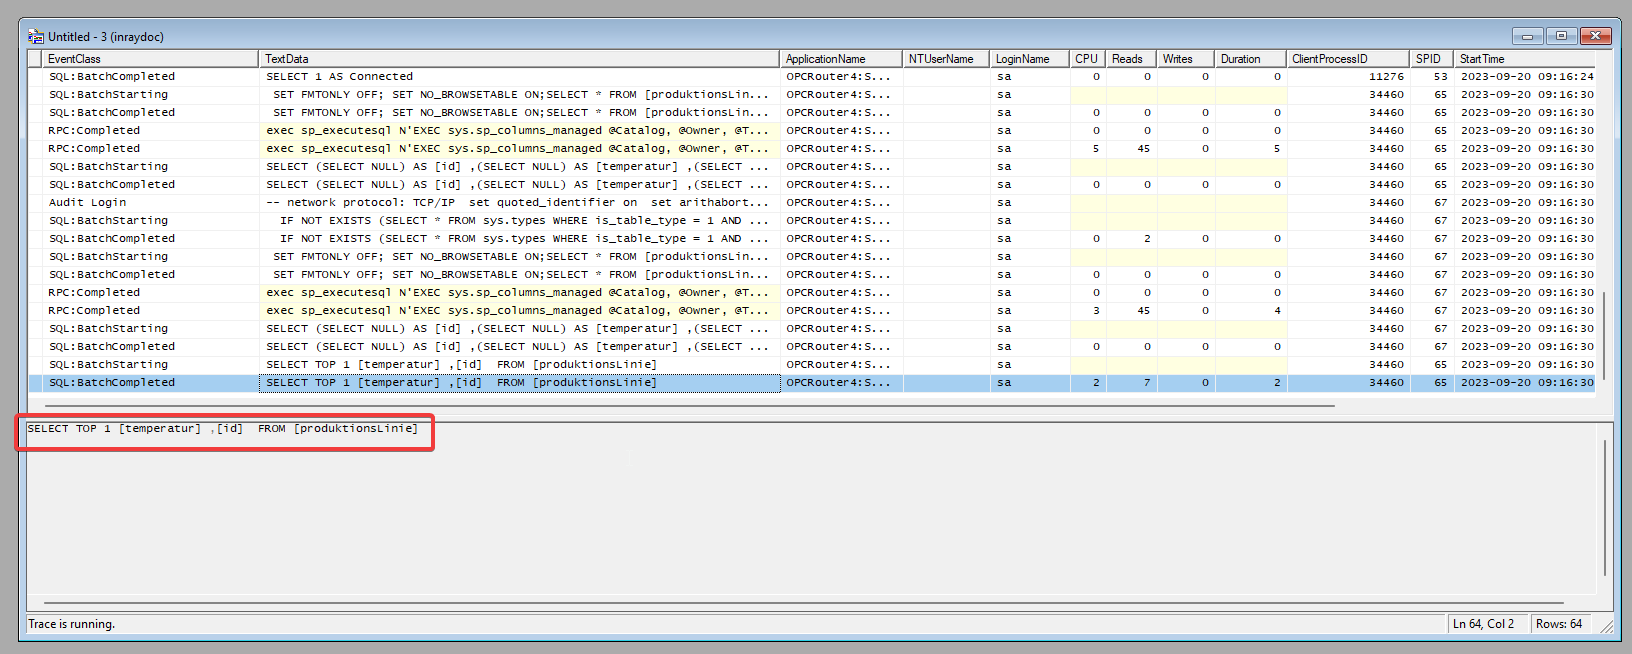
Select a query from the log and copy the query text.
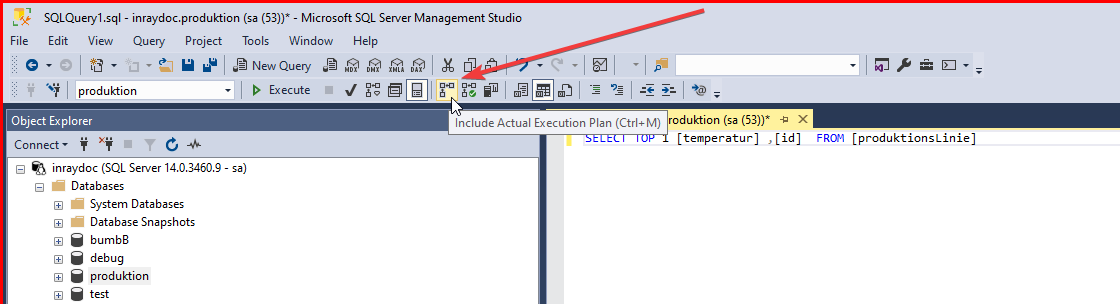
Enable execution plan
In Management Studio, click "New Query," paste the copied query text into a new query tab, and enable the "Include execution plan in output" option.
Evaluate the execution plan
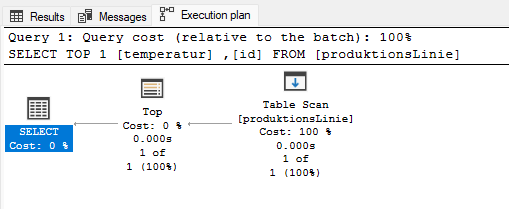
After executing the query, an additional "Execution Plan" tab appears at the bottom.
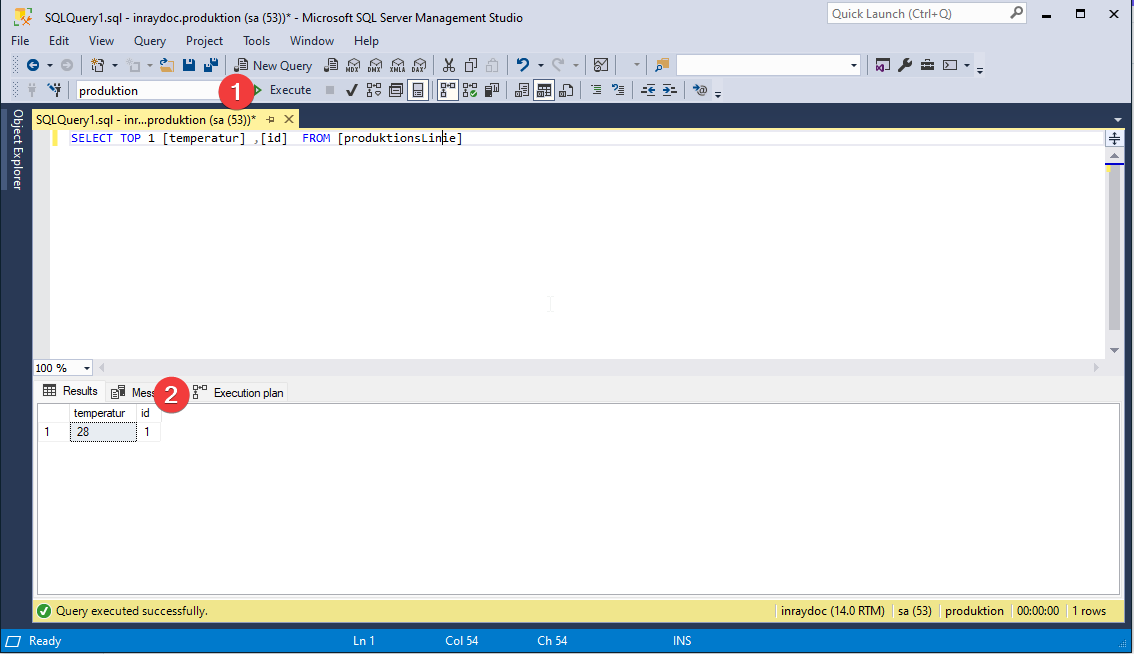
In the execution plan, you can see detailed information about the individual operations of the SQL Server and their load. If applicable, you may also see warnings about missing indexes or similar issues here. This can help you determine why execution is taking a long time.
If your query is an UPDATE or INSERT, you may also see the associated trigger activities there. For a SELECT query, table joins and views, among other things, become visible.