Connection Status

The Status Chart
The Status Chart provides detailed information about individual data transfers.
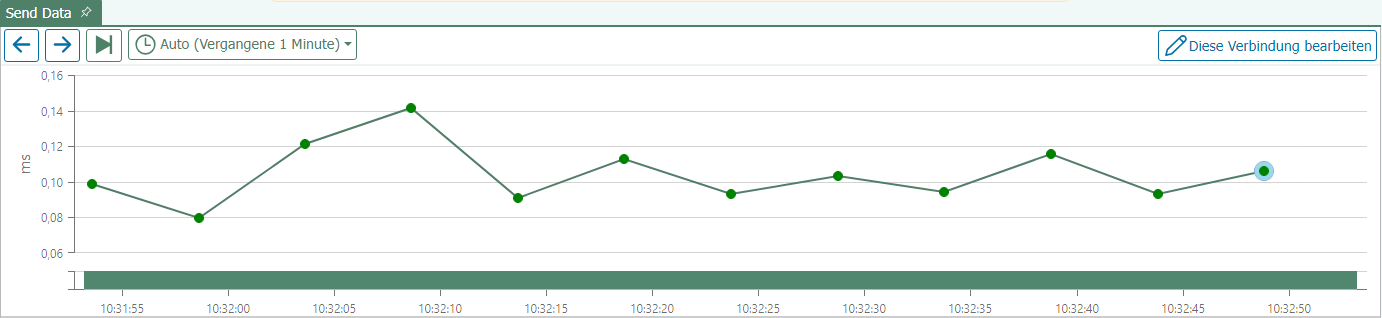
- Green transfer points represent individual transfers that were successfully completed. The transferred values are stored in the status database. The retention period for the stored values is defined in the settings.
If you click on a transfer point for which the retention period has expired, the message “Transfer values cannot be displayed because the retention period for the values has expired” appears.
Red transfer points indicate failed transfers and are retained longer in the long-term storage database. - Purple transfer points indicate transfers that run via Store and Forward. A purple dot appears as soon as the transfer is complete and the data is cached—regardless of whether it has already been forwarded at that point. Whether the cached data has already been forwarded or is still pending can be seen in the Store-and-Forward status view of the corresponding plugin instance.
- Yellow transfer dots indicate transfers that were classified as warnings—for example, for query transfer objects when the transfer was aborted due to an empty query result. You can specify whether such a case is treated as a warning (yellow) or an error (red) in the query section of the respective transfer object (for example, DB Select – Query).
- When you click on a transfer point, it is highlighted in light blue and the transferred data is displayed in the connection.
- When you hover your mouse over a transfer point, the execution time is displayed.
- When you hover over the Gantt chart below the status chart, you can see the current connection status. The current escalation level is also displayed here.
- Above the status chart, you’ll find the “Previous Transfer” and “Next Transfer” buttons, which let you view the transfer immediately before or after the currently selected one.
Use the “Switch to Live View” button to monitor the progress of individual transfers. - You can adjust the zoom level using the mouse wheel.
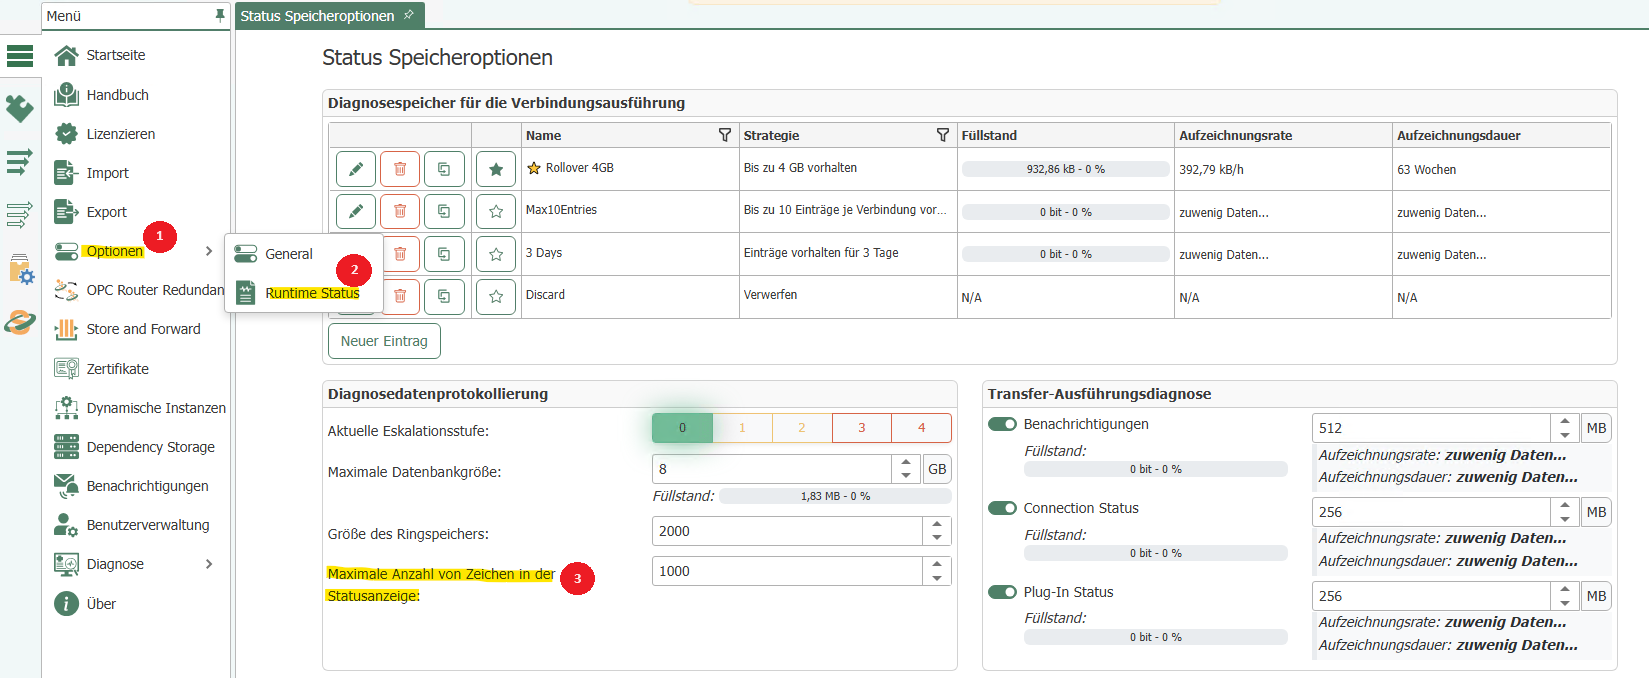
- If strings or arrays are too long, the transferred value will be truncated in the display—but it will, of course, be transmitted in full. The display length can be adjusted in the status options under Diagnostic Data Logging. The default value is 1,000 characters.
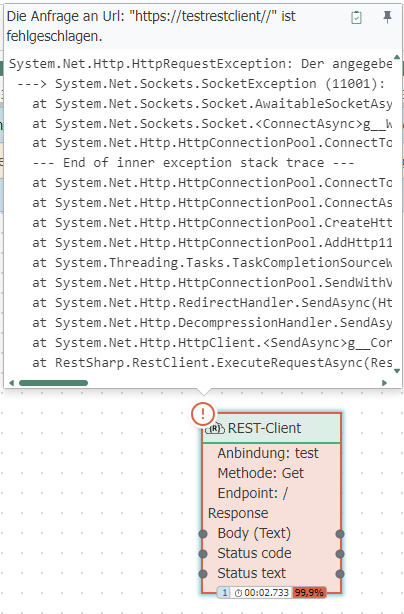
- Errors are indicated by a red marker on the status chart. If you hover your mouse over the faulty transfer object in the connection, detailed information about the error will be displayed:
- The status Gantt chart changes color if an error occurs in the plug-in, a warning appears, or the connection is terminated.
The status Gantt chart is displayed in orange (Checking Connection) when the connection is being checked, and in red when the connection is in the "Error" state (error in the plug-in). If the connection is working correctly, the status Gantt chart appears in green (Ready).
When the OPC Router is shut down, all connections are set to the “Shutdown” status. In the history, this status is then displayed in red.
In the status tree, you can manually start a connection’s transfer by right-clicking. A trigger does not need to be present in the connection for this. Manually initiated transfers are displayed in blue on the chart. Additionally, the system records who initiated the transfer.
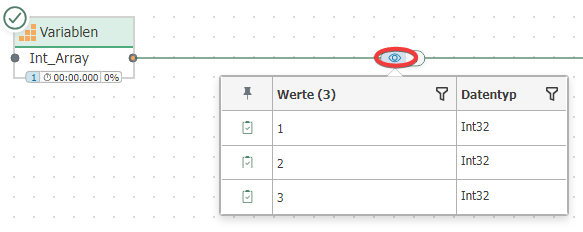
Clicking the “eye” icon of a transfer displays the complete array or stream.
Escalation Levels for Status Logging
If status logging has been disabled, a warning appears in the status display. If logging has been completely disabled at escalation level 4, the affected time period is shaded gray.
For a more detailed explanation of the escalation levels, visit the Escalation Levels page.