Service Status
When you click on  in the status view, a dashboard opens displaying service status metrics.
Time Range
In the top-right corner, you can select the time period for which data should be displayed. The following time periods are available:
| Option | Description |
|---|---|
| Auto (Last 15 minutes) | Default; displays the last 15 minutes |
| Last 30 minutes | - |
| Last hour | - |
| Last 3 hours | - |
| Last 6 hours | - |
| Last 12 hours | - |
| Last day | - |
| Last 2 days | - |
| Last week | - |
| Last 4 weeks | - |
Quick Stats
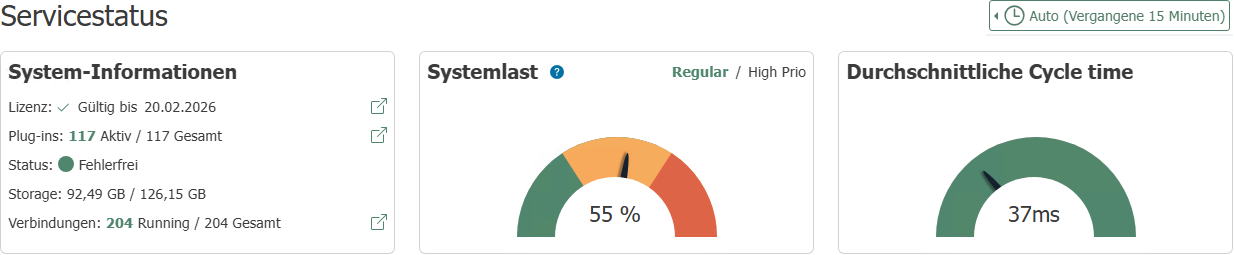
The Quick Stats card displays current status information without historical data. The values are updated every 5 seconds.
| Section | Description |
|---|---|
| License | Validity of the active license |
| Plug-ins | Number of active and total configured plug-ins; link to the plug-in overview |
| Health | Color-coded overall status of all subsystems |
| Storage | Used hard disk space in the application directory; warning if utilization exceeds 80% |
| Connections | Number of running and configured connections; link to the connection overview |
System Load Balance
The System Load Balance card displays the Transfer Manager's backpressure as a gauge (0-100%).
Use the toggle switch to select which worker group is displayed:
- Regular: Utilization of normal and low-priority workers
- High Prio: Utilization of high-priority workers
Backpressure indicates how many transfer requests could not be processed immediately and were cached. A consistently high value indicates a bottleneck in the Transfer Manager and may point to excessive connection load or too few worker threads.
Average Work Cycle Duration
The Average Work Cycle Duration chart shows the average processing time per item in the Transfer Manager in milliseconds. The value is displayed relative to the configured cycle time.
Performance
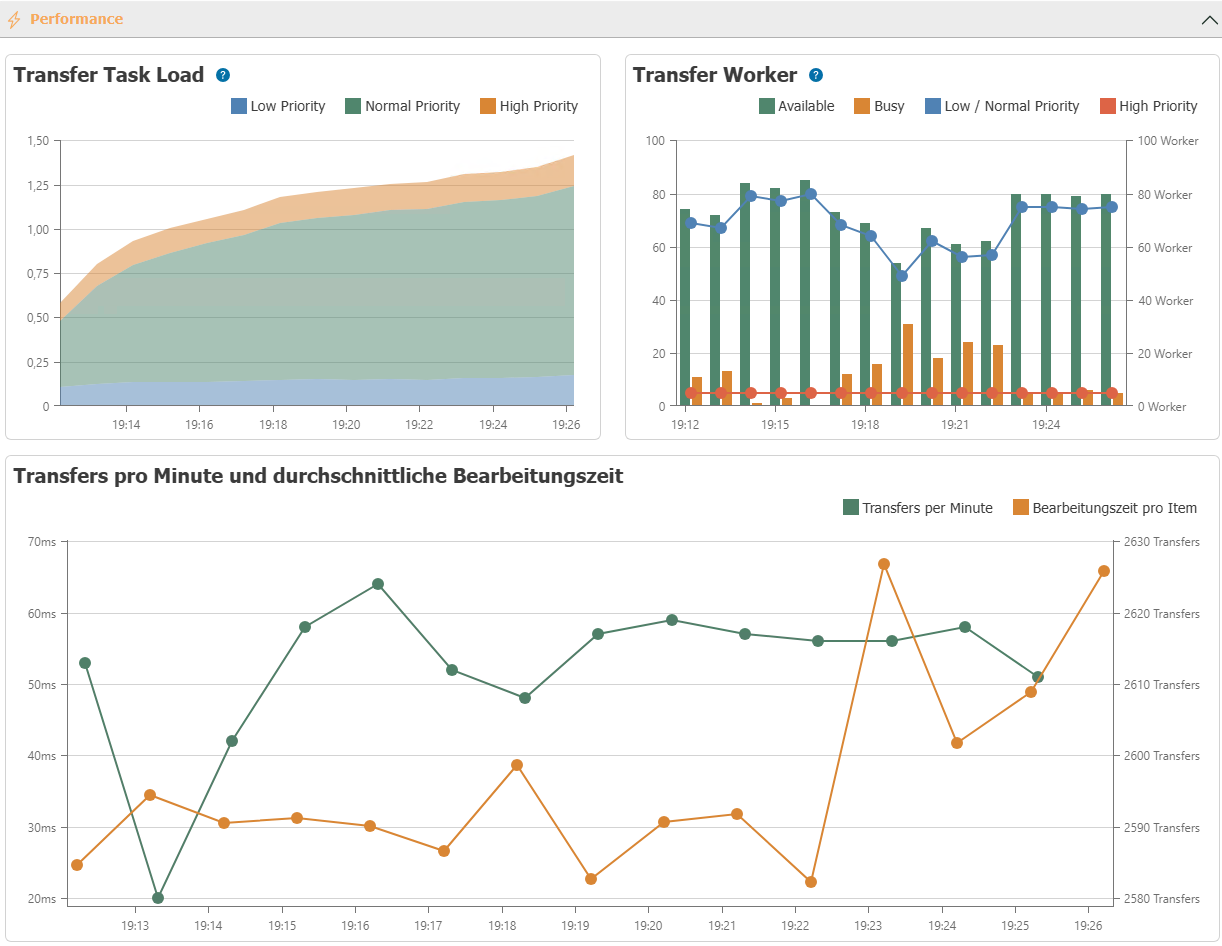
This section displays:
- how much the OPC Router is utilized, grouped by connection priorities.
- how many Transfer Workers of each priority are active.
- how many Transfer Workers are available or busy.
- how many transfers are performed per minute and what the processing time is for individual items.
Timing
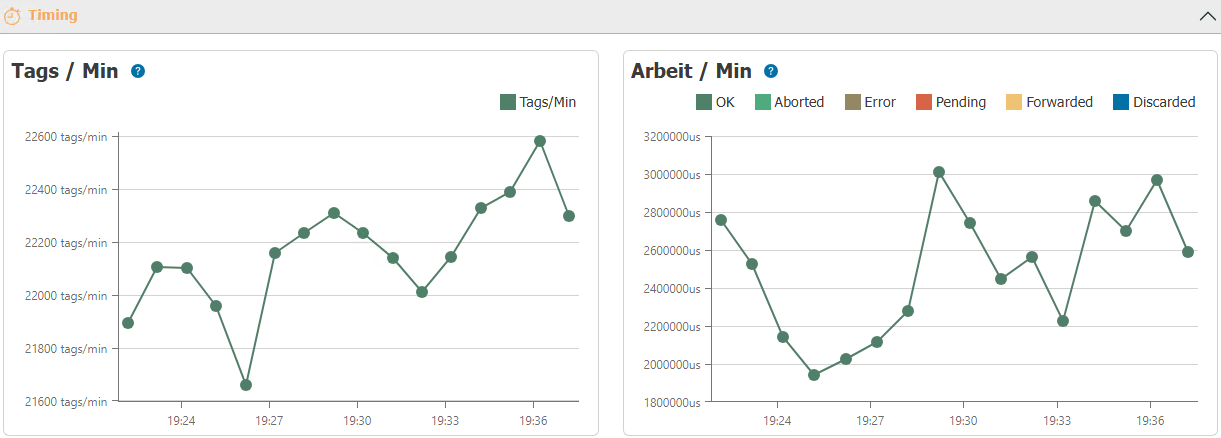
This section displays:
- how many operations the Transfer Manager performs per minute.
- how long the Transfer Manager took to complete the operations, grouped by final result.
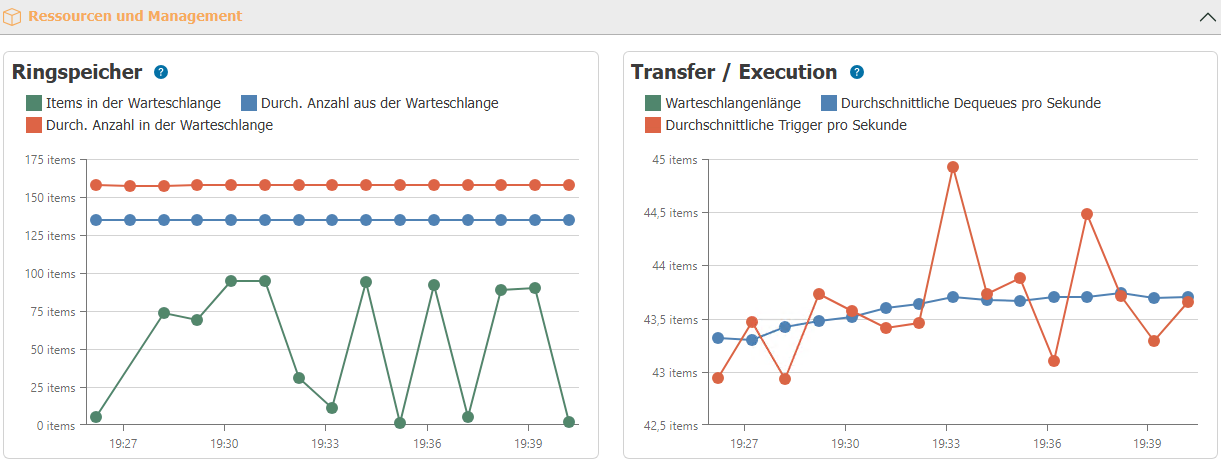
Resources and Management
This section shows:
- how many elements are in the ring buffer.
- how many elements are added to the ring buffer on average.
- how many elements are removed from the ring buffer on average.
Event Log
This section lists the OPC router's log messages.
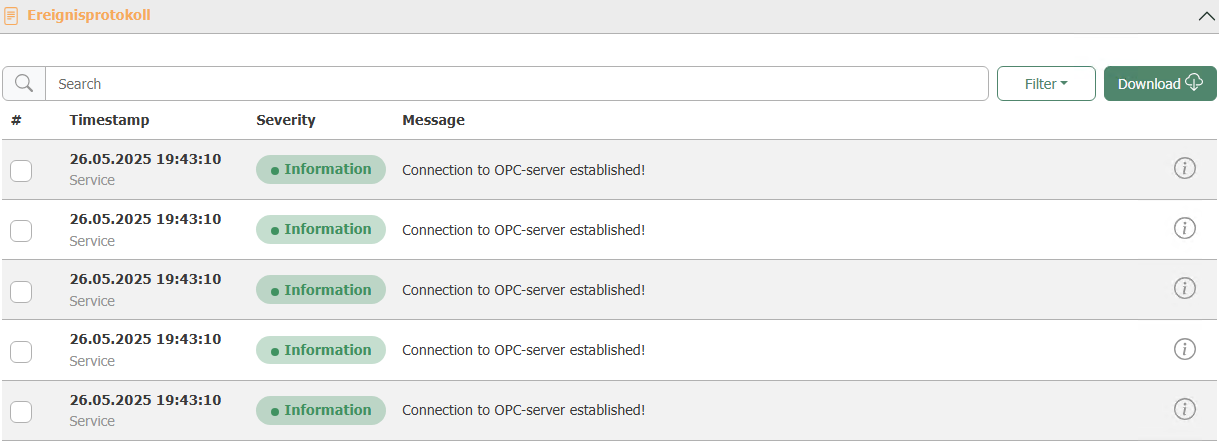
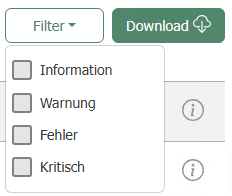
Messages can be filtered by severity: Info, Warning, Error, and Critical. A search field for free-text searches is also available.
The Download button allows you to export the displayed entries as an Excel file.