Status Indication backup
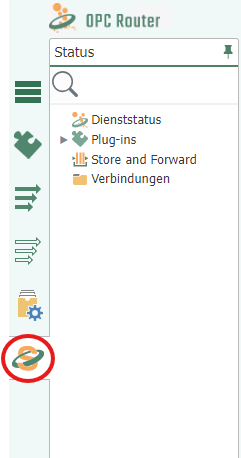
In the snap-in bar is the button for the status area.
After clicking on the button and a connection the status window opens:
Note: Folders that are contain only deactivated connections are shown crossed out.

The Status Window
The status chart provides detailed information about the individual data transfers. The status chart can be started via the corresponding snap-in in the left margin.
- Green transfer points represent the individual transfers that were in order and the transfer values are stored in the short storage. The lead time is defined in the settings. If you click on a transfer point where the lead time has expired, the message “Transfer values can not be displayed because the lead time of the values has expired”. The red transfer points, however, indicate erroneous transfers and are kept permanently in the Long Storage.
- If you click on a transfer point, it will be shown in light blue and the data will be displayed under the status chart.
- If you move the mouse to a transfer point, the execution time is displayed.
- Above the status chart, you will find the buttons “Previous Transfer” and “Next Transfer” to display the transfer next to the previously selected transfer. With the button “Switch to live view”, you can observe the progress of the individual transfers.
- The zoom can be changed with the mouse wheel.
- If strings or arrays are too long, the preview of the transferred value is shortened at the end – the value is nevertheless transferred completely. The length can be adjusted in the settings under Options/ Status Storage /Maximum amount of signs in status. The default value is 1000 characters.“

- Errors are indicated by the red marking in the status chart and if you move the mouse over the transfer object field under the status chart, you will get detailed information about the error:
- The status bar changes color when an error occurs, a warning appears, or the connection is broken. The status bar turns orange (checking the connection) when the connection is checked and shown in red if the connection is not present (error in the plug-in). If everything is OK, the status bar will turn green (Ready).
- You can also view the messages of the plug-ins at Status snap-in.
- When you switch from status to plug-in snap-in, you automatically enter the edit mode of the open connection.
- In the status snap-in in the Plug-in tree, select a Plug-in and display the messages for it:

When the OPC Router shuts down, all connections get the status “Shutdown” In the history, the status then appears in red.
In the status tree, you can start the transfer of a connection manually by right-clicking. It is not necessary for a trigger to be present in the connection. The manually started transfers are displayed in blue in the chart. In addition, it is recorded who started this transfer.
If you click on the "eye" of a transmission, the complete array or the complete stream is displayed.

Escalation levels for status recording
The OPC Router now detects when too many status data are recorded or the database memory is almost full. In order to prevent full RAM memory, the OPC Router automatically initiates ever-increasing countermeasures. The transmission of user data is NOT adjusted by these measures! The measures only affect the status records of the OPC Router. The recording of the user data should be ensured. In the basic settings of the OPC Router, you set how far the OPC Router is allowed to fill the status databases.
The following escalation levels are available:
- Escalation level 0:
- Normal behavior
- Escalation level 1:
- Ring buffer exceeded batch size
- Status database filled to 60%
- Action: No more transfer values of successful transfers log (only for spam connections)
- Escalation level 2:
- Ring memory batch size exceeded by three times
- Status database filled to 80%
- Action: No more transfer values from successful transfers
- Escalation level 3:
- Ring buffer size exceeded by six times
- Status database filled to 90%
- Action: No longer log transfer values
- Escalation level 4:
- Ring memory batch size exceeded by ten times
- Status database filled to 100%
- Action: Disable status recording of transfers completely
If the status recording has been disabled, there is a warning in the progress bar. If the recording has been completely deactivated at escalation level 4, the affected period will be shaded in gray.