Service Status
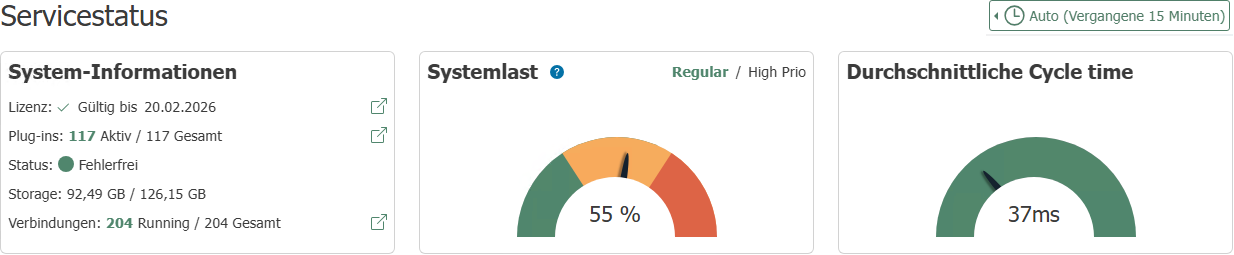
When you click on !![]() in the status view, a dashboard with service status values opens.
in the status view, a dashboard with service status values opens.
In the upper right corner, you can set the time period for which data is to be displayed.
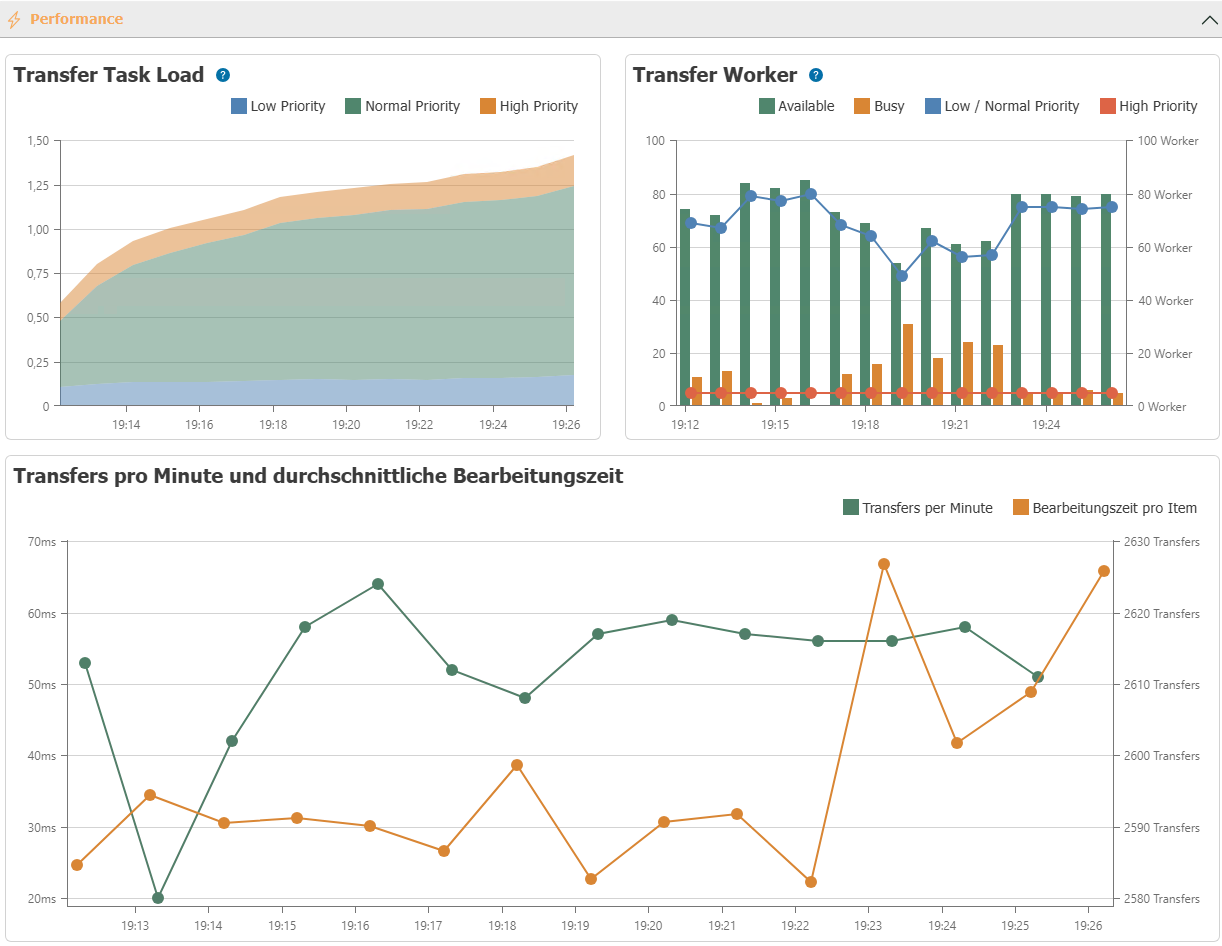
Performance
This section displays:
- How much the OPC Router is being utilized, grouped by connection priorities.
- How many transfer workers of each priority are active.
- How many transfer workers are available or busy.
- How many transfers are performed per minute and how long the processing time is for individual items.
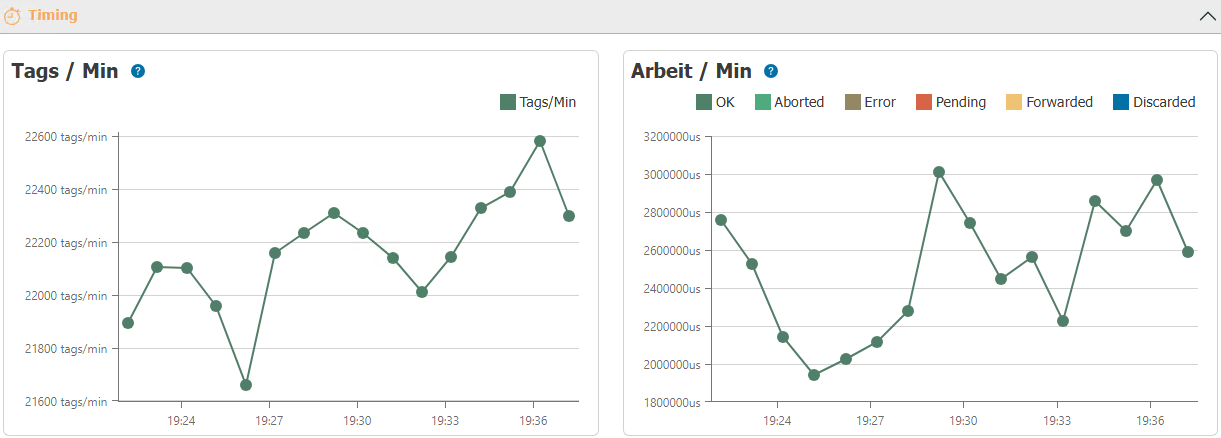
Timing
This section shows:
- how many operations the transfer manager performs per minute.
- how long the transfer manager took for the operations, grouped by final result.
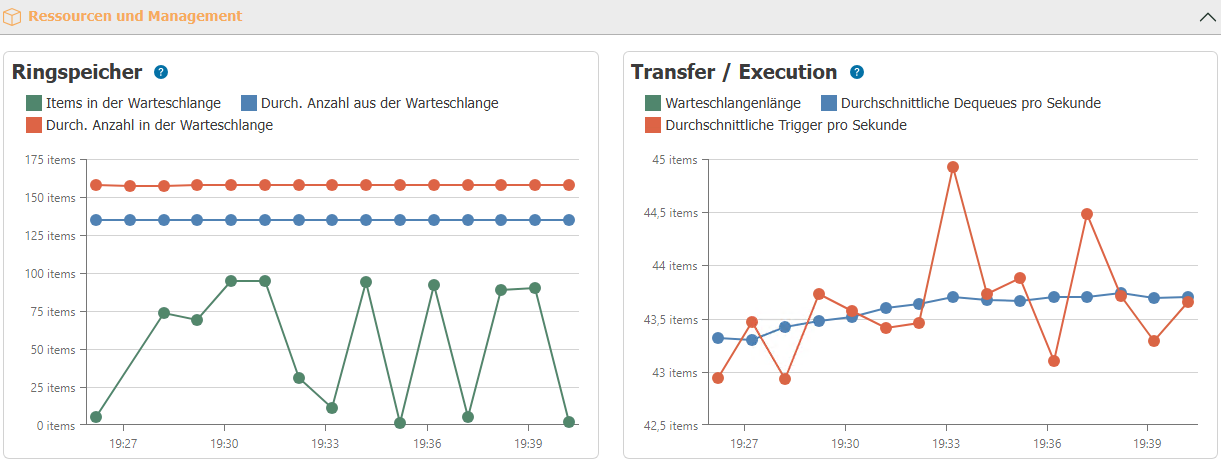
Resources and Management
This section shows:
- How many elements are in the ring buffer.
- How many elements are added to the ring buffer on average.
- How many elements are removed from the ring buffer on average.
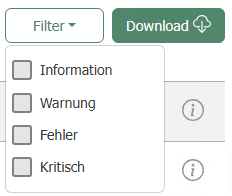
Event log
This section lists the log messages of the OPC router.
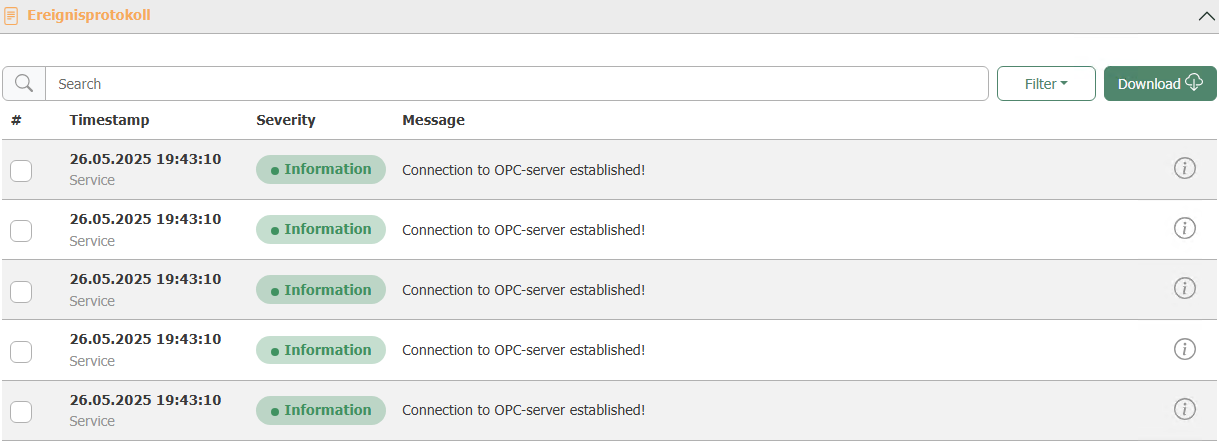 The messages can be filtered by message type. It is also possible to download the logs.