Plug-in Status
When you click on a plug-in instance in the status view, a dashboard opens with data on the selected plug-in instance.
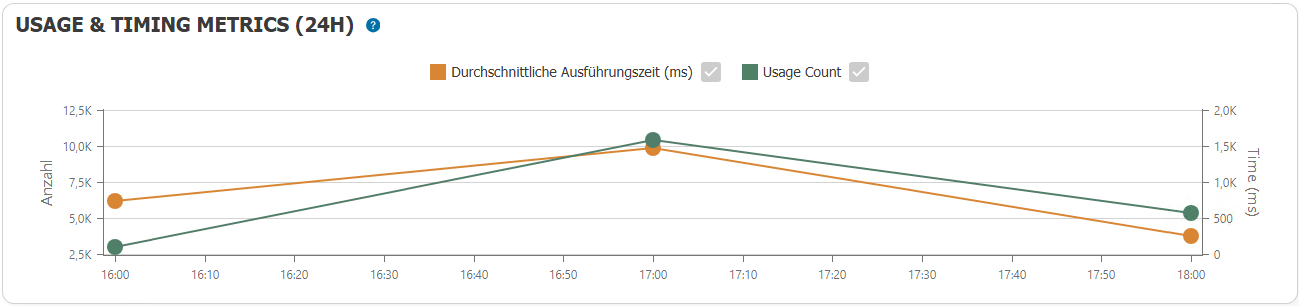
Usage & Timing Metrics
This section displays the following data grouped into full hours:
- Average execution time
- Number of uses
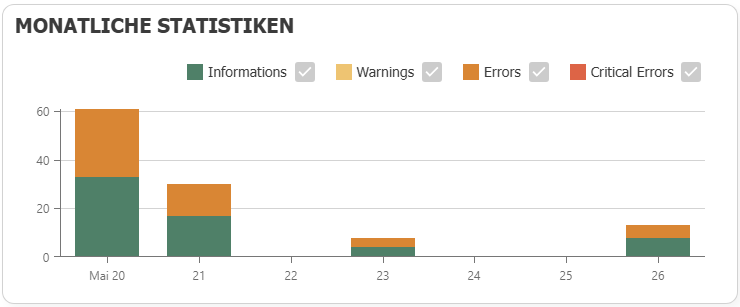
Monthly Statistics
This section provides a graphical representation of the number and type of log messages.
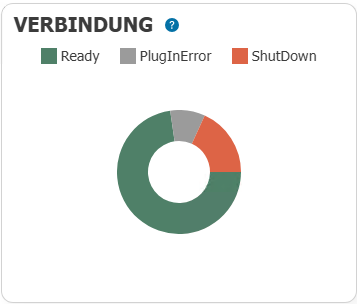
Connections
This section shows the percentage of connections with each status.
note
Please note that this refers to the status of all connections.
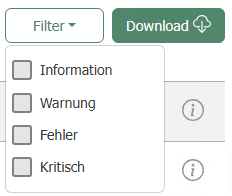
Event log
This section lists the log messages of the plug-in.
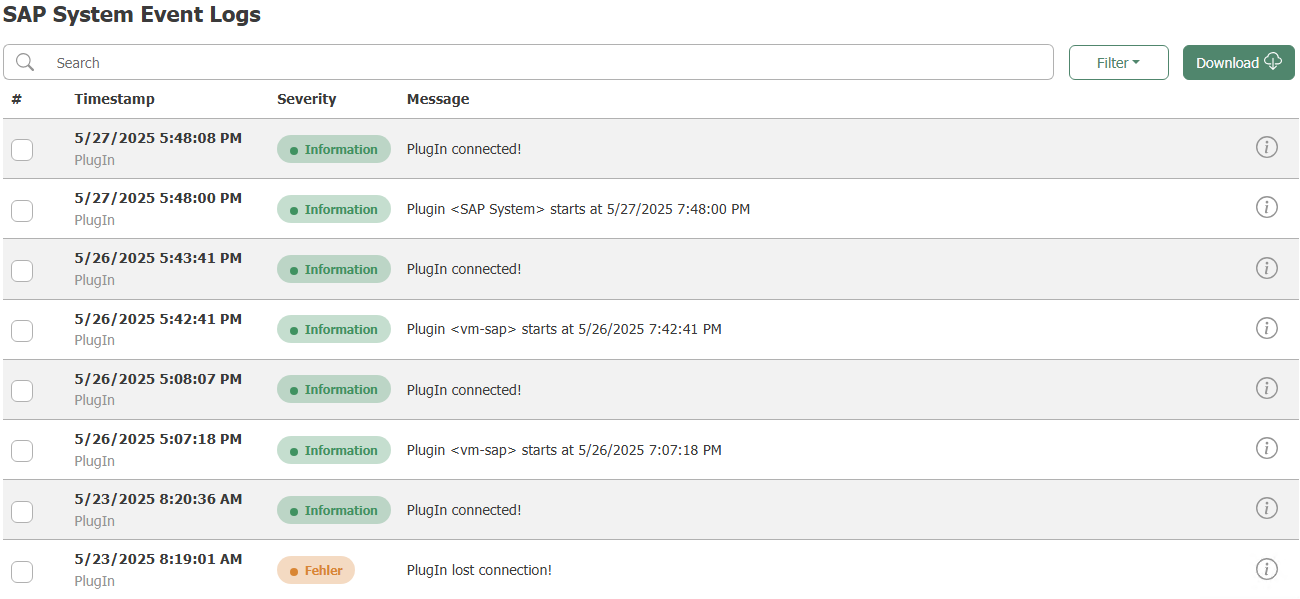
The messages can be filtered by message type. It is also possible to download the logs.