Service Status
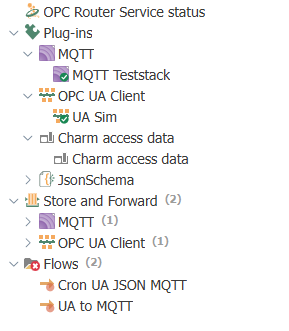
The “OPC Router Service status” node at the very top of the status tree opens the service dashboard. It provides an overview of how the system is performing as a whole: The three cards at the top show the current status, while the sections below display the history over a selectable time period.
Time Range
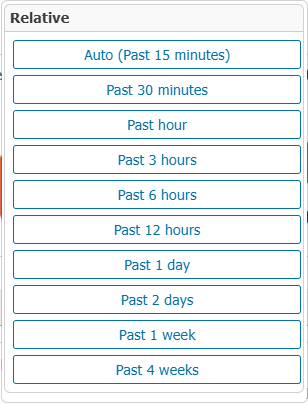
In the upper-right corner, select the time period from which the historical data is taken. This selection applies to all charts on the page.
| Option | Description |
|---|---|
| “Auto (Past 15 minutes)” | Default value; displays the last 15 minutes |
| “Past 30 minutes” | - |
| “Past hour” | - |
| “Past 3 hours” | - |
| “Past 6 hours” | - |
| “Past 12 hours” | - |
| “Past 1 day” | - |
| “Past 2 days” | - |
| “Past 1 week” | - |
| “Past 4 weeks” | - |
The three cards
The maps show the current status without historical data and are therefore independent of the selected time frame.

System Information
The “System info” card summarizes what the service is currently processing.
| Row | Description |
|---|---|
| License | The active license, for example, a demo license |
| Plug-ins | Number of active and total configured plug-ins; the icon next to it opens the plug-in overview |
| Status | Overall status of all subsystems, color-coded |
| Storage | Used and total available hard disk space in the application directory |
| Flows | Number of running and configured flows; the icon next to it opens the flow overview |
System Load
The “System load” card displays the Transfer Manager's backpressure as a pointer gauge (0–100%). Use the toggle switch next to it to select which worker group is displayed: Regular for normal and low-priority workers, High Prio for high-priority workers.
Backpressure indicates how many transfer requests could not be processed immediately and were queued. A consistently high value indicates a bottleneck in the Transfer Manager and may point to an excessively high flow load or too few worker threads.
Average cycle time
The “Average Work Cycle Duration” card displays the average processing time per item in the Transfer Manager, in milliseconds. The value is shown relative to the configured cycle time.
Performance
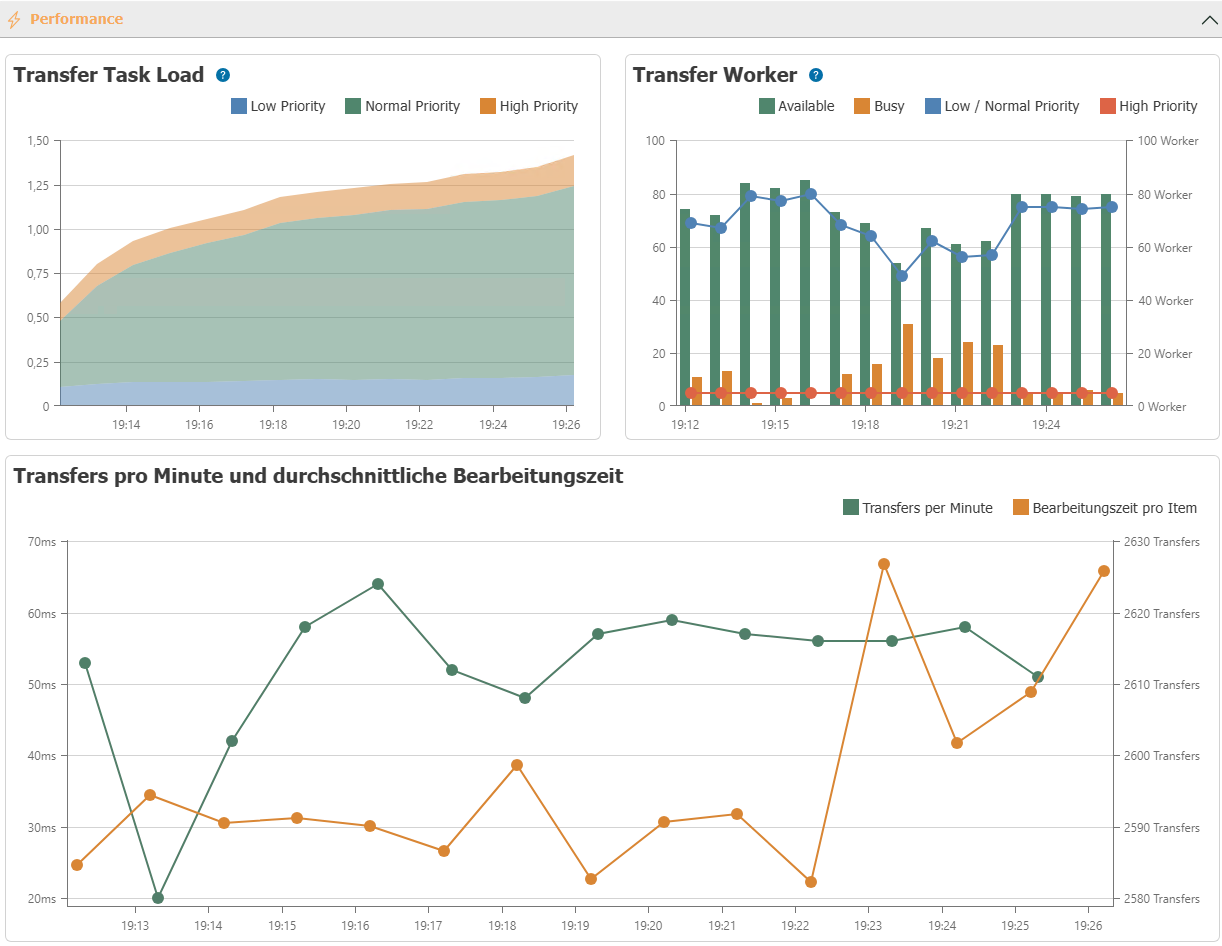
This section shows the Transfer Manager’s workload during the selected time period:
Transfer Task Load– how heavily the OPC Router is utilized, grouped by flow priorities.Transfer Worker– how many Transfer Workers of each priority are active, available, or busy.- “Transfers per minute & average processing time” – how many transfers are being performed and what the processing time is for individual items.
Timing
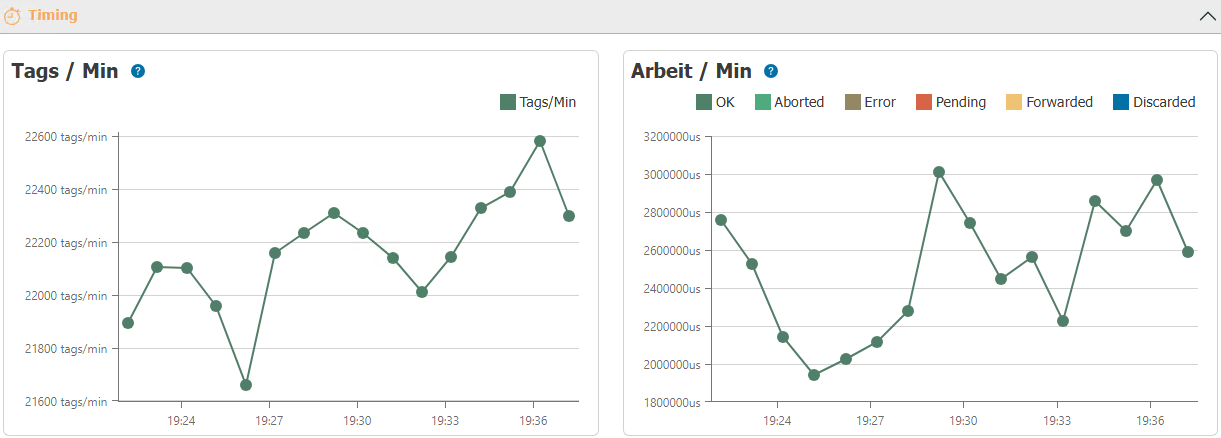
This section shows the throughput of the transfer manager:
Tags / Min– how many operations the Transfer Manager performs per minute.- “Work / Min” – how long the Transfer Manager took to complete the operations, grouped by final result.
Resources and Management
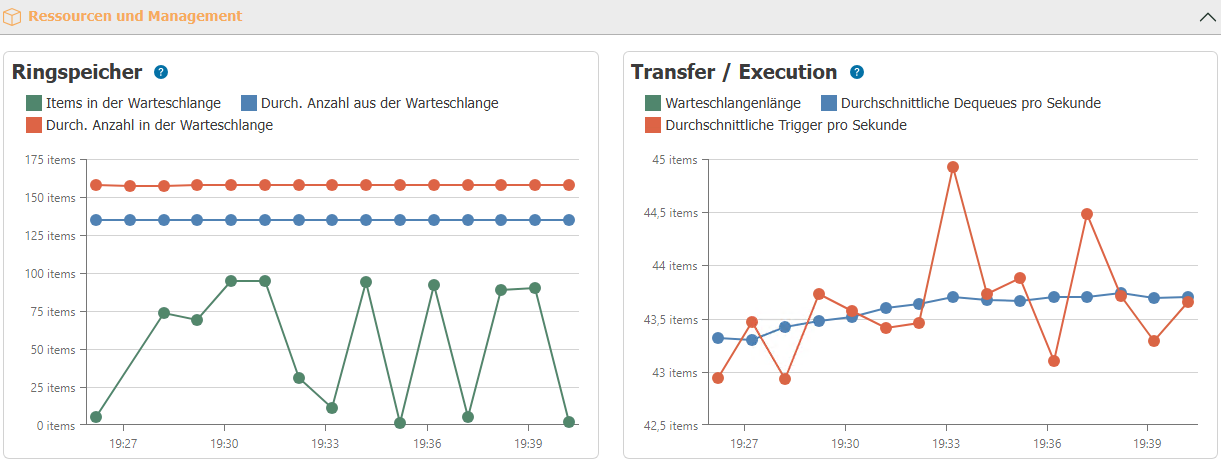
This section shows the status of the ring buffer, where the status data is temporarily stored:
- “Circular Storage” – how many elements are in the ring buffer.
Transfer / Execution– the average number of elements added and removed.
Event Log
The “Event Logs” section lists the service's messages, including a sequential number, timestamp, severity level, and message text.
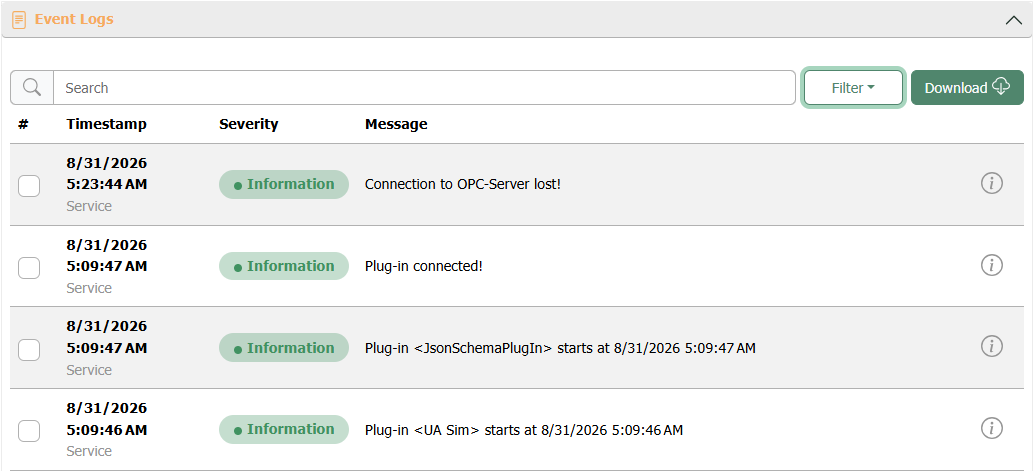
- The search field searches the messages as free text.
- Use “Filter” to filter by severity levels: “Information,” “Warning,” “Error,” and “Critical.”
- Use
Downloadto export the displayed entries as an Excel file.
The event log comes from the status database, not from the service’s log files. It only goes back as far as the event retention period specified in the settings allows, and it does not contain every line written to a log file. You must download the log files separately—see Log Files and Event Log.