OPC data transfer via transfer object
Systems
Host
Operating system: Windows 11
RAM: 32 GB
Processor: Intel i7-8700
Virtual machines
OPC Router
Operating system: Windows Server 2022
RAM: Dynamic, up to 16GB
Virtual processors: 8
OPC Router: 5.3.5008.157 (inraySDK version: 3.32.6002.24)
Test server
Operating system: Windows Server 2025
RAM: 8 GB
Virtual processors: 6
OPC server: IoT Edge OPC UA PLC in Docker
Test setup
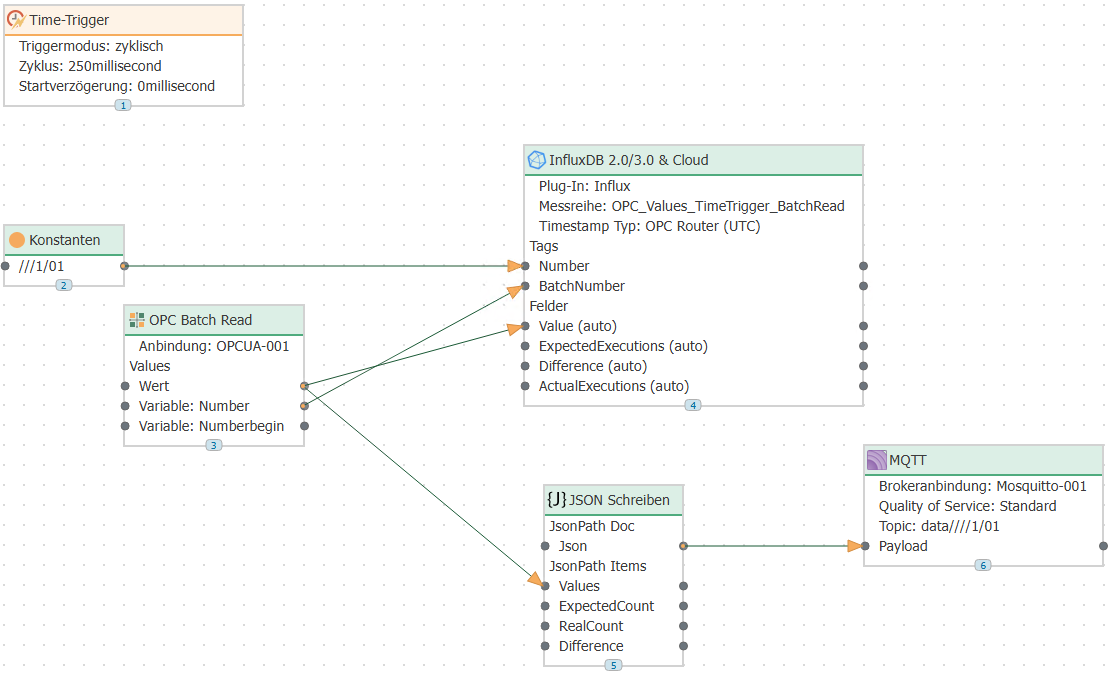
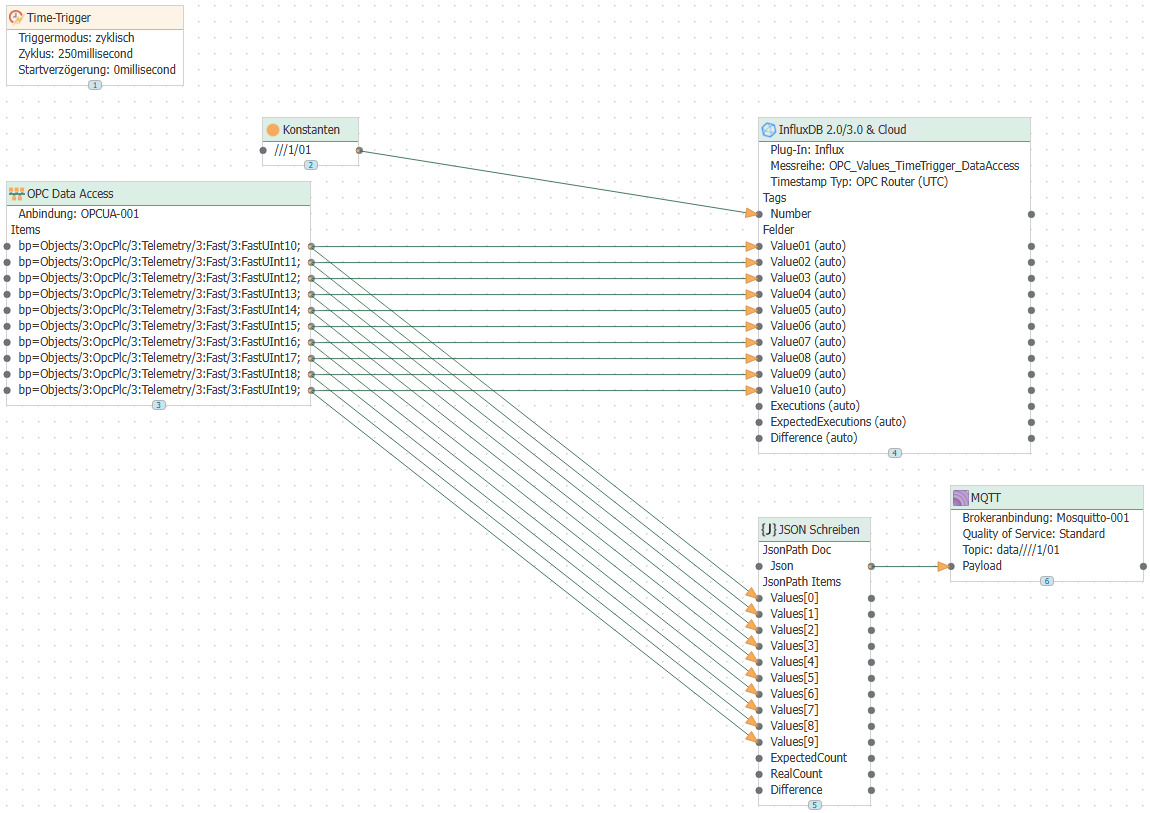
Ten data points were read in each connection using a batch read transfer object or a data access transfer object. The data is sent to MQTT and also written to an Influx database.
Separate tests were performed with data change triggers, time triggers, and cron triggers. Performance was determined by comparing the expected number of executions with the actual number of executions.
OPC-UA client plug-in settings
Some settings in the plug-in were adjusted for the test.
| Setting | Value |
|---|---|
| Register OPC tags at startup | Active |
| OPC Read Mode | Asynchronous |
In this test, we deliberately pushed the OPC Router and the OPC server used to and beyond their performance limits. Data rates of more than 19,500 tags per second were achieved.
Results when using the Cron trigger
With the Batch Read TO
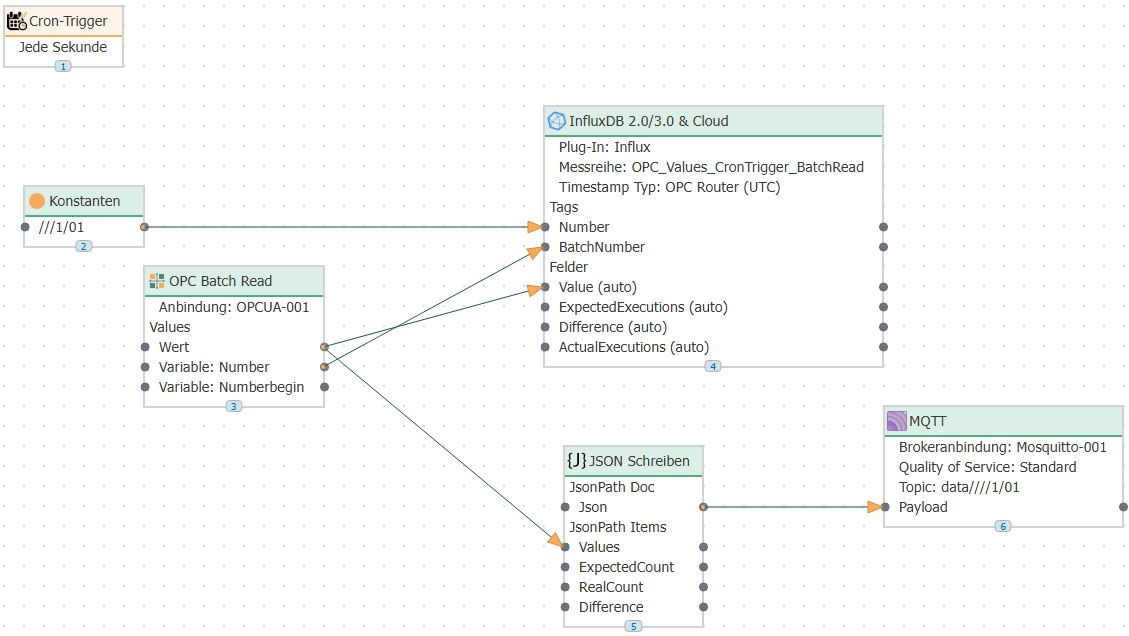
| Connections | Data points (total) | Trigger interval | Ø Executions / min | Expected |
|---|---|---|---|---|
| 10 | 1000 | 1 second | 60 | 60 |
With OPC Data Access TO
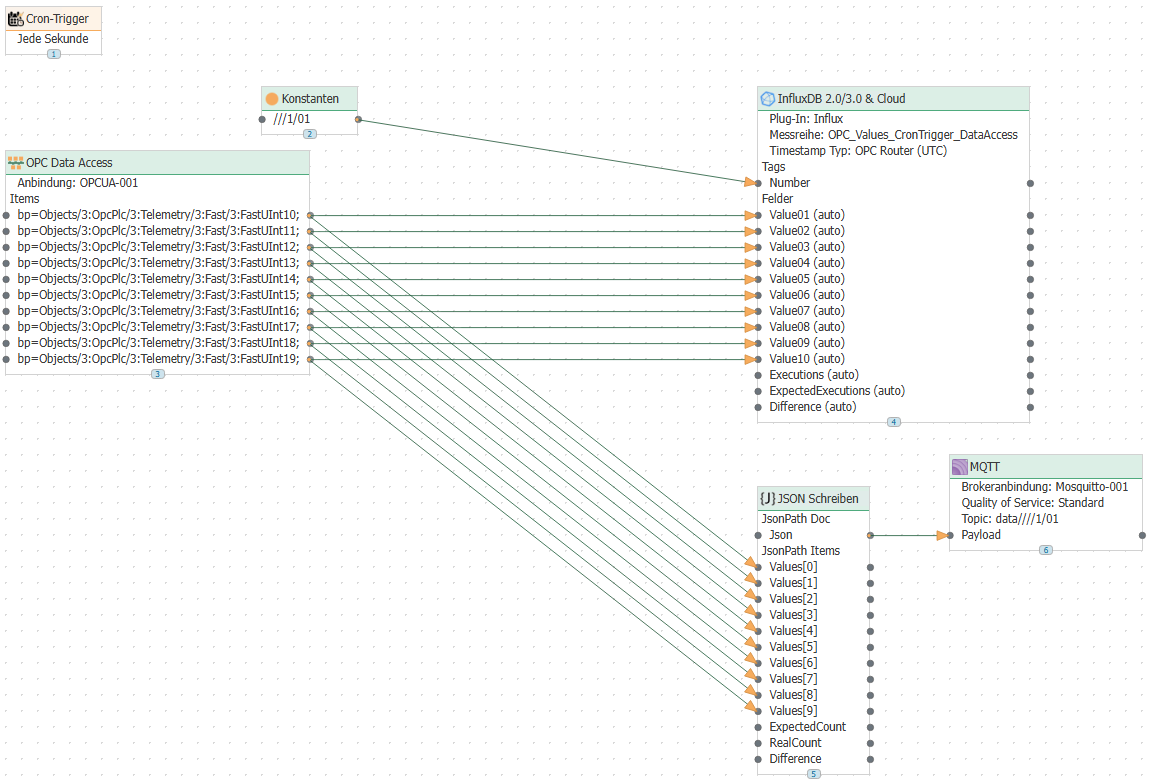
| Connections | Data points (total) | Trigger interval | Ø Executions / min | Expected |
|---|---|---|---|---|
| 10 | 1000 | 1 second | 60 | 60 |
Results when using the Datachange trigger
With a data change rate of 250 ms, the sample rate in the plug-in was reduced to 250 ms.
With Batch Read Transfer object
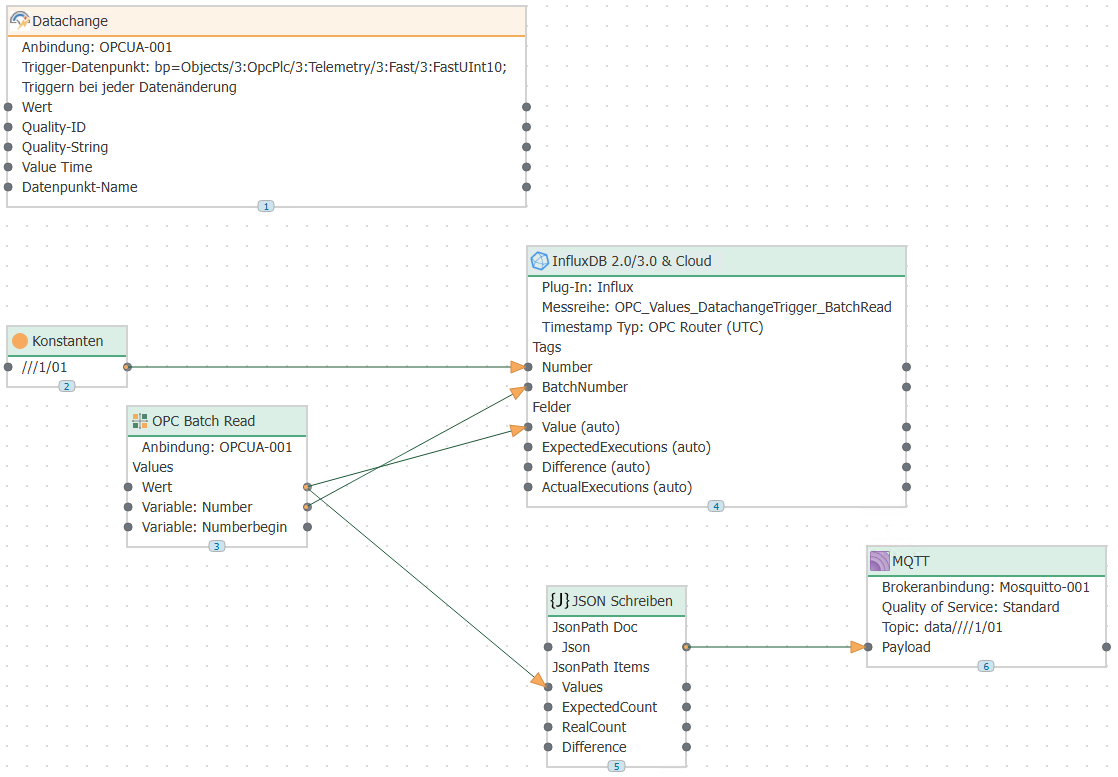
| Connections | Data points (total) | Data changes | Ø Executions / min | Expected |
|---|---|---|---|---|
| 10 | 1000 | 500 ms | 118.9 | 120 |
| 500 | 5000 | 500 ms | 120 | 120 |
| 500 | 5000 | 250 ms | 192.2 | 240 |
| 250 | 2500 | 250 ms | 198 | 240 |
| 100 | 1000 | 250 ms | 199.4 | 240 |
With OPC Data Access Transfer object
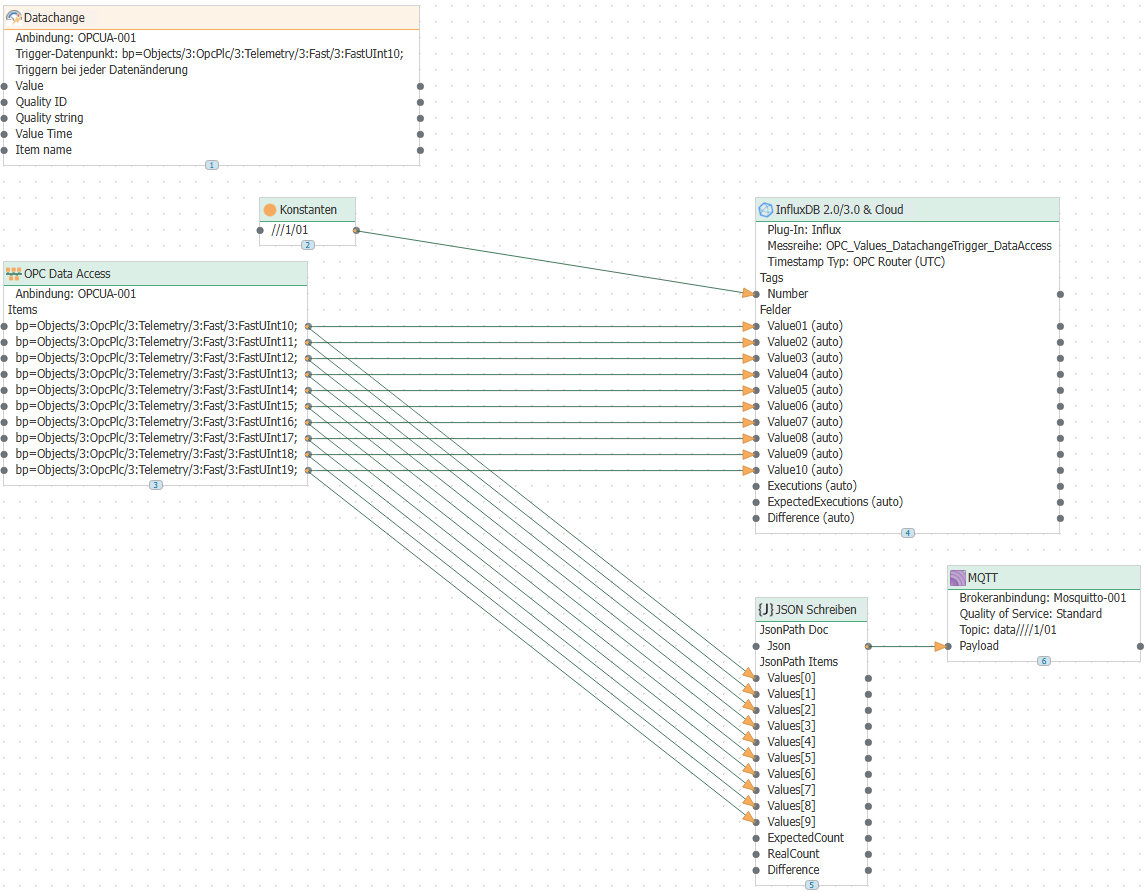
| Connections | Data points (total) | Data changes | Ø Executions / min | Expected |
|---|---|---|---|---|
| 10 | 1000 | 500 ms | 118.1 | 120 |
| 500 | 5000 | 500 ms | 120 | 120 |
Results when using the time trigger
Please note that the time trigger cycle is the time that is waited between executions.
With the batch read transfer object
| Connections | Data points (total) | Cycle | Executions/min |
|---|---|---|---|
| 100 | 1000 | 500 ms | 114 |
| 500 | 5000 | 500 ms | 114 |
| 500 | 5000 | 250 ms | 215 |
With the OPC Data Access Transfer Object
| Connections | Data points (total) | Cycle | Executions/min |
|---|---|---|---|
| 10 | 1000 | 500 ms | 114 |
| 500 | 5000 | 500 ms | 114 |
| 500 | 5000 | 250 ms | 214 |
| 250 | 2500 | 250 ms | 214 |
Project files
Download Benchmark_CronTrigger_BatchRead_1000.rpe
Download Benchmark_CronTrigger_DataAccess_1000.rpe
Download Benchmark_DatachangeTrigger_BatchRead_1000.rpe
Download Benchmark_DatachangeTrigger_DataAccess_1000.rpe
Download Benchmark_TimeTrigger_BatchRead_1000.rpe