Log Files and Event Log
If a flow reports an error at runtime, there are two sources—and they contain different information:
- The event log in the dashboards of the status display . It comes from the status database, can be filtered by severity, is searchable, and can be exported as an Excel file.
- The log files from runtime and Web Management. They are located in the server’s or container’s log directory and also contain information that is not recorded as an event.
The two are separate: The event log does not read the log files. If you cannot find a message in the event log, you must therefore check the log file.
At a Glance: The Event Log
Open the Status pane and select in the status tree
- the node “OPC Router Service status” for messages from the entire service—see Service Status ,
- —or the relevant plug-in instance for messages specific to that connection—see Plug-in Status .
The “Event Logs” section displays the sequence number, timestamp, severity level, and message text—the table column headers and the message texts themselves are in English even in the German interface. Use the search field to find a message via free-text search, or use “Filter” to filter by the severity levels “Information,” “Warning,” “Error,” and “Critical,” and by clicking “Download,” you can export the displayed entries as an Excel file—for example, to forward them to support.
Download Log Files
Use the menu “Diagnosis > Log files” to download the log files as a ZIP archive without needing access to the server. There are four buttons and no built-in viewer—open the extracted files with a text editor.

| Button | Content |
|---|---|
| “Management log file” | the Web Management log file for the current day |
| “Management log file (last 3 days)” | the Web Management log files for the last three days |
| “Runtime log file” | the Runtime log file for the current day |
| “Runtime log file (last 3 days)” | the Runtime log files for the last three days |
Users with the Observer role may download log files without being able to make any other changes—see User Roles .
The log files on the system
| Directory (Windows) | _<Installationsverzeichnis> _ \LogDir |
| Directory (Container) | /var/log/opcrouter – one of the mount paths , so that the files survive a new container |
| Runtime | OPCRouterService<jjjjMMtt>.txt |
| Web Management | WebManagement<jjjjMMtt>.txt |
Each file begins with a header block that lists the process, start time, and version numbers. This is followed by one line per message containing the timestamp with time zone offset, severity level in square brackets, message source, and message text:
2026-08-30 18:36:22.160 +00:00 [ERR] [MongoDbProvider:127.0.0.1:27017:OPCRouterRuntime] No VersionLog entry found
The files are rotated daily and additionally when they reach a certain size. By default, this is 1 GB per file, 31 files retained, and a retention period of 31 days; you can configure all three values in the “Log output” group (see below).
Exclude the log directory from virus scanning and make sure there is enough space on the drive: With the default settings, the folder can occupy up to 31 GB per service.
Record More: Change the Log Level
If the logging is insufficient, increase the logging level. To do this, open <Ui>Optionen > Monitoring und Diagnose</Ui> and navigate to the <Ui>Logausgaben</Ui> group.
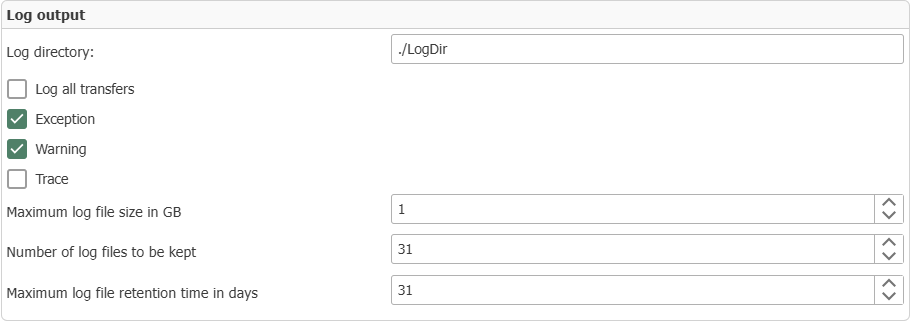
- During normal operation, errors and warnings are enabled. This is the recommended setting: The log file remains manageable, but the information is still available in the event of an error.
- “Trace” Enable these specifically for troubleshooting and then disable them again afterward—doing so will cause the log file to grow significantly.
- “Log all transfers” Logs every single data transfer. These settings take precedence over disabling logging for individual flows.
Changes take effect immediately; the service does not need to be restarted.
Configure Directory and Rotation settings
The log directory and the values used to rotate the files are located under the buttons in the same group:
| Field | Meaning |
|---|---|
| “Log directory” | Directory where the files are stored. If left blank, the directory LogDir in the application folder is used. |
| “Maximum log file size in GB” | Size at which a new file is started—in addition to the daily rotation. |
| “Number of log files to be kept” | How many files are retained. |
| “Maximum log file retention time in days” | How long a file is retained. |
Three additional buttons in this group appear only in the “Expert mode”:
| Switch | Effect | Default |
|---|---|---|
| “Debug” | additionally records debug messages | |
| “Zip log files” | stores the log files in compressed format | |
| “Managing mongoDB log files” | enables the OPC Router to also manage the MongoDB log files |
The environment variable OR_LOG_LEVEL overrides these settings. As long as it is set, only the list specified there applies, and the checkboxes in the interface have no effect. See Configurable Environment Variables .
Forward logs to a central system
If you do not want to collect the log files from each router individually, you can send the log output to a central collector. On the same settings page, under the “Telemetry and log export settings” section, you’ll find the “Zentrale Log-Erfassung über OTLP” card. It exports the logs; the cards next to it export the metrics—their fields and destination addresses are listed at Metrics Export .
This section is part of the Enterprise+ add-on. If you do not have the appropriate license, the page will display a notice; see License Levels .
If Support needs the documentation
To generate a complete set of project configuration, database backups, log files, and Windows Event Viewer data, create an "" diagnostic report at .