Status memory options
Diagnostic memory for connection execution
New diagnostic memories for connection execution can be created here. The values transmitted in a connection are stored in these diagnostic memories. These are displayed when you click on a point in the status chart of a connection.
Preconfigured diagnostic memory for connection execution
| Name | Description |
|---|---|
| Rollover 4GB (default) | Stores a maximum of 4 GB of data, after which old data is overwritten. |
| Max10Entries | Stores a maximum of values from the last 10 executions per connection. |
| 3 Days | Stores data for 3 days. Older data is deleted. |
| Discard | No data is stored. Discard is useful if there is no need to store the transferred data. This saves storage space. |
Overview of diagnostic memories for connection execution
The diagnostic memories are listed in a clear table.
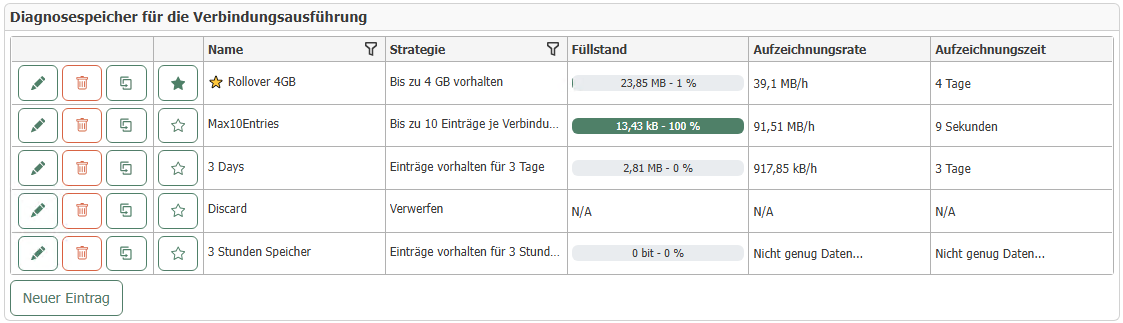 Each row has buttons on the left side for editing, deleting, and duplicating the diagnostic memory. The star button can be used to set a diagnostic memory as the default. You can find out how these memories can be used for connections here: [settings-for-connections-and-templates.md](../faq/connection_projecting/settings-for-connections-and-templates.md "mention").
Creating a diagnostic memory for connection execution
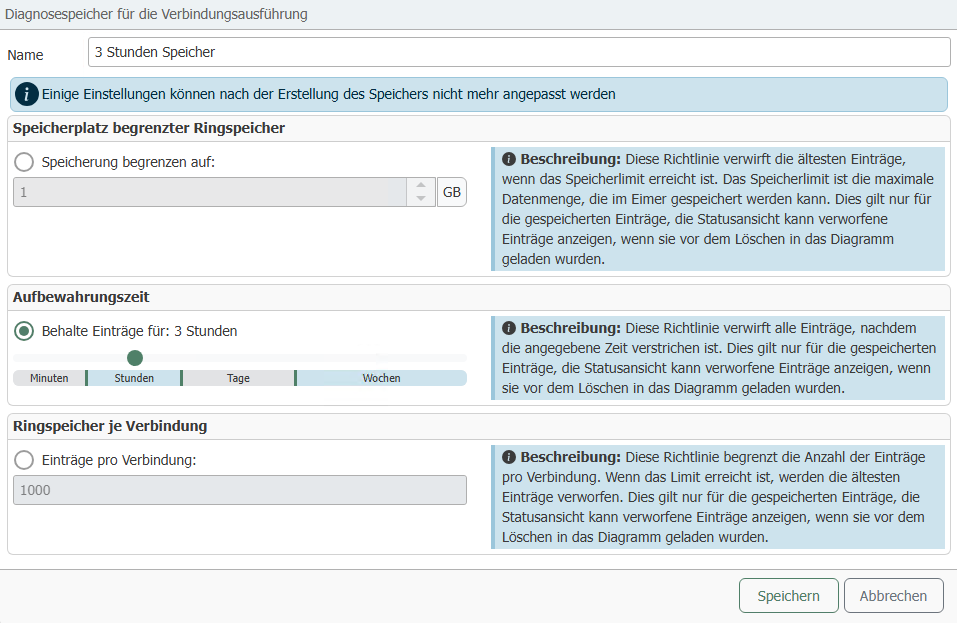
The following properties can be configured for a diagnostic memory:
| Property | Description |
|---|---|
| Name | The name for the diagnostic memory. It is used to identify the diagnostic memory during project planning. |
| Type of limitation | Storage space of limited ring memory: Here you can specify the amount of data that is stored before data is overwritten. |
With storage space limited ring storage, the actual size on the data carrier may slightly exceed the specified limit, resulting in a fill level of more than 100% being displayed in Web Management. This is because the limit refers to the user data in MongoDB. The additional metadata is not taken into account.
After creation, the newly created storage is displayed in the overview.
Diagnostic data logging
Here you can clearly see what the current escalation level is.
For more information, see: [eskalationsstufen.md](../faq/eskalationsstufen.md "mention")
-8a49401155785d5f8b5ea1d1847a5447.png)
The following options can be configured for diagnostic data logging
| Property | Description |
|---|---|
| Maximum database size | The maximum amount of data to be stored in GB. Used to calculate the escalation level. |
| Size of ring buffer | The number of entries in the ring buffer. Default value: 2000 entries. |
| Maximum number of characters in status display | The maximum number of characters that can be stored for a value in the status display. |
Diagnosis of transmission execution
Here you can configure which diagnostic data of the transmission execution is to be recorded and in what quantity it is to be retained.
The following data can be recorded:
| Data | Description |
|---|---|
| Notifications | History of sent notifications. Default value: 512 MB. |
| Connection status | The status of connections. E.g., "Ready" or "Plug-in Error." |
| Plug-in Status | The status of plug-ins. E.g., "Ready" or "Error." |
Diagnosis of the runtime service
Here you can configure which diagnostic data of the runtime service should be recorded and in what quantity it should be stored.
The following data can be recorded:
| Data | Description |
|---|---|
| Service events | History of service events. Default value: 256 MB. |
| Service status | Status history of the runtime service. Default value: 256 MB. |
| Service Health | Health of the runtime service. Default value: 256 MB. |
| Performance Metrics | Data about the performance of the OPC router. Default value: 256 MB. |
If sufficient data is available, an estimated recording rate and duration is specified for the diagnostic data of the transfer execution and runtime service. This may look like this, for example:
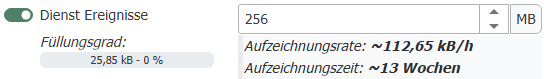
Approximately 112.65 kB of data per hour is recorded here. This means that the data can be stored for approximately 13 weeks before it is overwritten.